To solve these measurement problems, a small piece of lab equipment was developed in our own Lab. This device became so useful and beneficial for the application, that it was decided to apply for a patent on the technical design, and to package the product professionally.
The final result is a CE approved professional piece of test equipment, which we can supply to potential customers who will certainly have similar measurement issues.
Working principle:
The Clipper has a HI and LO setting. The transfer function is as follows:
For HI setting:
If input >= 12V then
output = 12V
Else
output = input
For LO setting:
If input >= 2V then
output = 2V
Else
output = input
For negative voltages, the current design has an input range of 0 to -1.7V, for which the input is transferred to the output. Below -1.7V the transfer is non-linear. An continuous absolute maximum of -5V permitted on the input terminals.
The Measurement Problem:
The following scope screen captures shows the problem of measuring a low voltage signal in the presence of a high voltage.
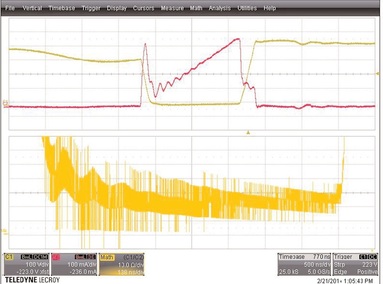
In picture 1, the CH1 400V input is measured together with a current probe CH2. The resulting maths function (Vds/Ids) shows the Rdson with a large quantisation problem (i.e. not enough sampling resolution in the 100mV range because the full 400V input is being sampled).
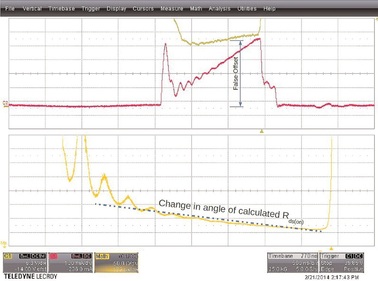
In picture 2, the CH1 400V input has had the range expanded to 6V/Div. This solves the sampling resolution issue, but the input amplifiers are now overloaded, resulting in a distorted (offset) calculated Rdson.
|
Picture 1: Top trace yellow shows input voltage at 100V/Div. Red trace is FET current from current probe. Yellow trace below is calculated RdsON showing lack of resolution.
|
Picture 2: By increasing the display resolution to 6V/Div, the sampling resolution has now been improved, but the overloaded Scope input has caused an incorrect measurement offset, and hence the calculated RdsON is not reliable.
|
Solution:
The Clipper provides a solution to this problem, by removing the unwanted high voltage before it reaches the Oscilloscope. The resulting waveforms can be seen below (Note: Application shown is Power Factor Correction with inductive load on FET).
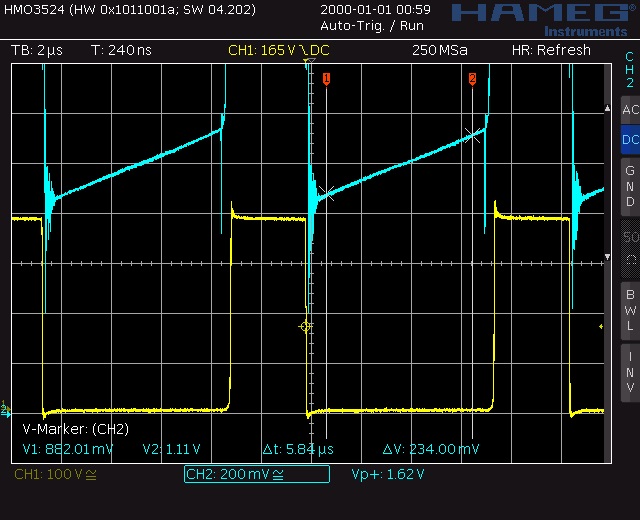
Picture 3, CH1 (yellow) shows the original switched Vds waveform, at a resolution of 100V/Div. The blue trace (CH2) shows Vds output from the clipper at a resolution of 200mV/Div.
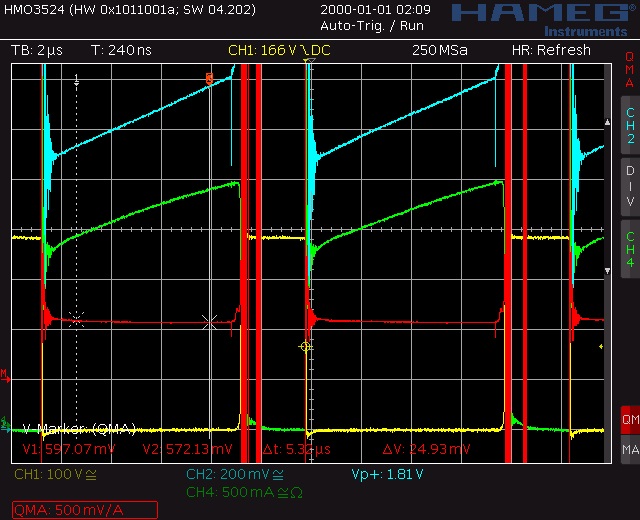
Picture 4, CH1 (yellow) and CH2 (blue) are the same, but CH3 (Green) has been attached to a current probe at 500mA/Div, with CH4 (red) displaying Rdson using the MATH function (resolution 500mOhm /Div).


